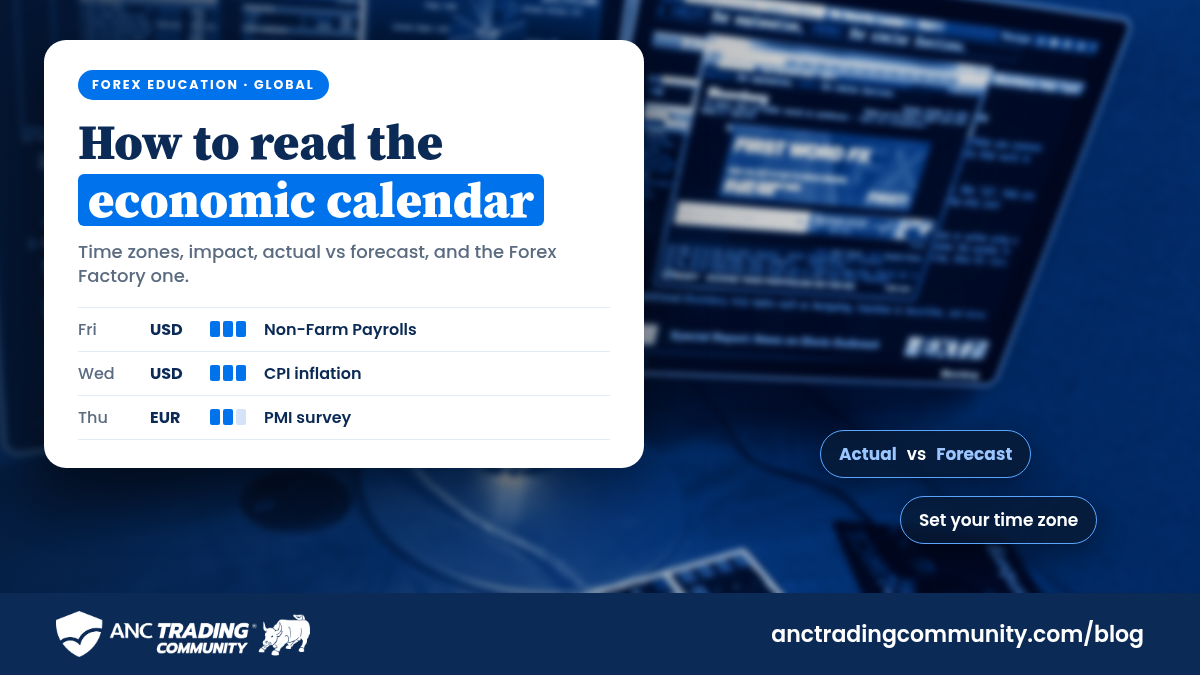

Here is how to read the economic calendar in short: check the time in your own time zone, the currency and the impact level, then compare the actual number with the forecast. The gap between actual and forecast moves price, not the number on its own. Forex Factory and almost every other economic calendar share this layout, so once you learn one, you can read them all.
Below, we cover each column, the colours, the big events, gold and news risk. The method is the same in New York, London, Riyadh, Mumbai, Singapore, São Paulo or Lagos.
What Is an Economic Calendar?
An economic calendar is a schedule of data releases, central bank decisions and key speeches. Each row shows what is coming, when it lands and how much it tends to move markets.
Traders use it for two jobs. First, it shows when a spike is likely. Second, it shows what the market expects, so you can judge good or bad news. To read the economic calendar well, keep our own economic calendar open beside this guide and follow along.
How to Read the Economic Calendar, Column by Column
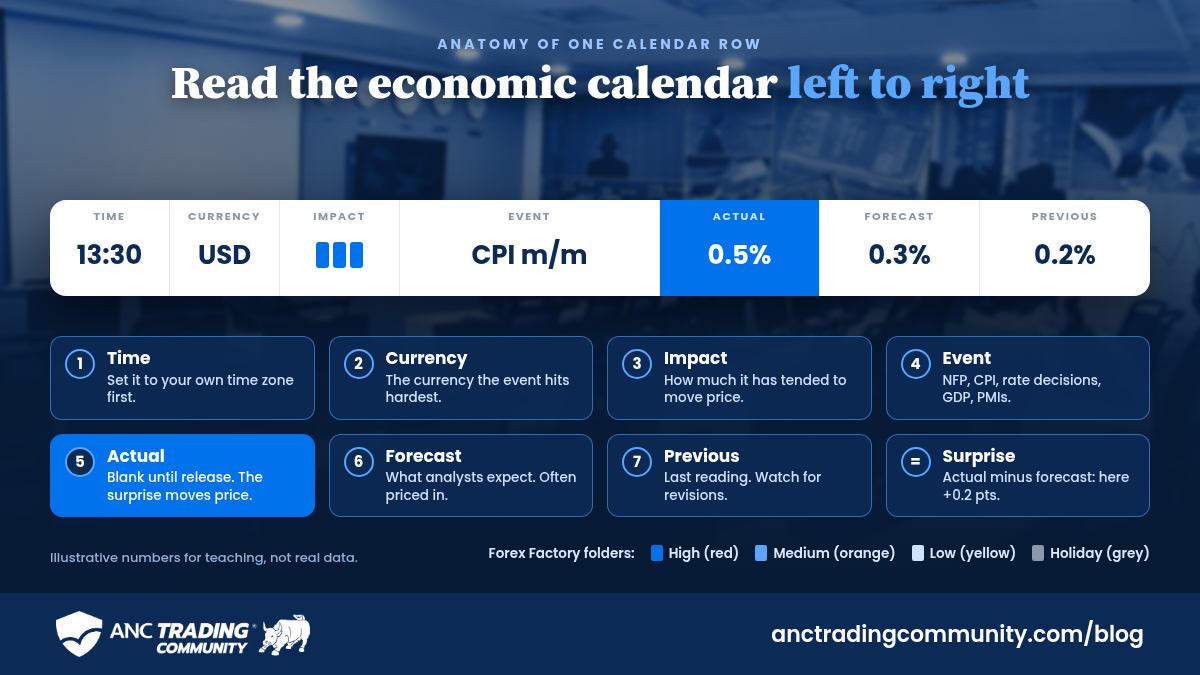
Almost every calendar uses the same columns, left to right.
Time and time zone
This is when the number comes out, in the time zone the calendar uses. Forex Factory sets a default based on your country, and you can change it from the clock in the page header. Also, its own note says all times are approximate and subject to change.
Currency and impact
This column shows which currency the event hits hardest. A USD row matters for EUR/USD, USD/JPY and gold. Next, the impact column shows how much the event has tended to move price. It is a guide, not a signal of which way price goes.
Actual, forecast, previous and revised
- Actual: the real figure. It stays blank until the release.
- Forecast: what analysts expect. Markets tend to price it in early.
- Previous: the last reading, for context.
- Revised: sometimes the agency corrects the previous number on release day. Forex Factory adds a small revision marker next to it. A big revision can change the whole story.
Impact Levels and Forex Factory’s Folder Colours
When you read the economic calendar on Forex Factory, small coloured folders show the expected impact:
- Red folder: high impact.
- Orange folder: medium impact.
- Yellow folder: low impact.
- Grey folder: not data, such as a bank holiday.
After the release, the actual figure turns green when it beats the forecast for that currency, and red when it misses. A revision to the previous figure gets the same colours. Still, green does not mean “buy”. It only shows which side of the forecast the number landed on.
Key Events to Read on the Economic Calendar
When you read the economic calendar each week, these are the rows to circle first.
- Non-Farm Payrolls (NFP): the US jobs report. It tends to land on the first Friday of the month at 8:30am New York time.
- CPI: consumer price inflation. A hot print tends to lift rate hike bets.
- FOMC rate decision: the Federal Reserve meets eight times a year. Watch the statement and the press conference.
- Other central banks: the ECB, Bank of England and Bank of Japan move their own currencies the same way.
- GDP: the widest measure of growth. The first US estimate comes about a month after the quarter ends.
- PMIs: surveys where 50 splits growth from decline. They arrive early in the month.
Actual vs Forecast: How to Read Economic Calendar Surprises
Markets move on surprises, and this is the heart of how to read the economic calendar. The forecast already sits in the price, so an in-line number often brings only a small move. In contrast, a big miss or beat forces a fast repricing.
For most data, a higher actual helps the currency. However, some figures work the other way. A higher unemployment rate, for instance, counts as bad news.
A worked example: read the economic calendar like a trader
Say the calendar shows US CPI with a forecast of 0.3% and a previous figure of 0.2%. We made these numbers up for teaching.
- Actual 0.5%: hot. So traders may price higher US rates for longer, and the dollar often jumps.
- Actual 0.3%: in line. As a result, the first spike may fade fast.
- Actual 0.1%: a soft print. Then rate cut hopes often grow, and the dollar may fall.
Then check for a revision. If the agency lifts last month’s 0.2% to 0.4%, a 0.3% print looks softer than it first seems.
How Gold Reacts to US Data
If you trade gold, read the economic calendar for US data first. Gold trades in dollars, so XAU/USD often moves against strong US numbers. A hot NFP or CPI print tends to lift US yields and the dollar, and that tends to weigh on gold. Weak data often does the opposite.
That link is a habit, not a rule. Fear can still lift gold on a strong dollar day. Our piece on why gold is falling this week shows the dollar link at work. New to the metal? Start with how to trade gold for beginners. Meanwhile, our note on USD/JPY at 160 shows how US data ripples into the yen.
Set Your Time Zone First
A wrong time zone is the classic first mistake. So, before you read the economic calendar, set it.
Take a US release at 8:30am New York time in northern winter. That is 13:30 in London, 14:30 in Lagos, 16:30 in Riyadh, 19:00 in Mumbai and 21:30 in Singapore. Daylight saving shifts these times in spring and autumn. Therefore, use the automatic option, or pick your city and let the calendar adjust.
Trading the News: Spreads, Slippage and Stand-Aside Rules
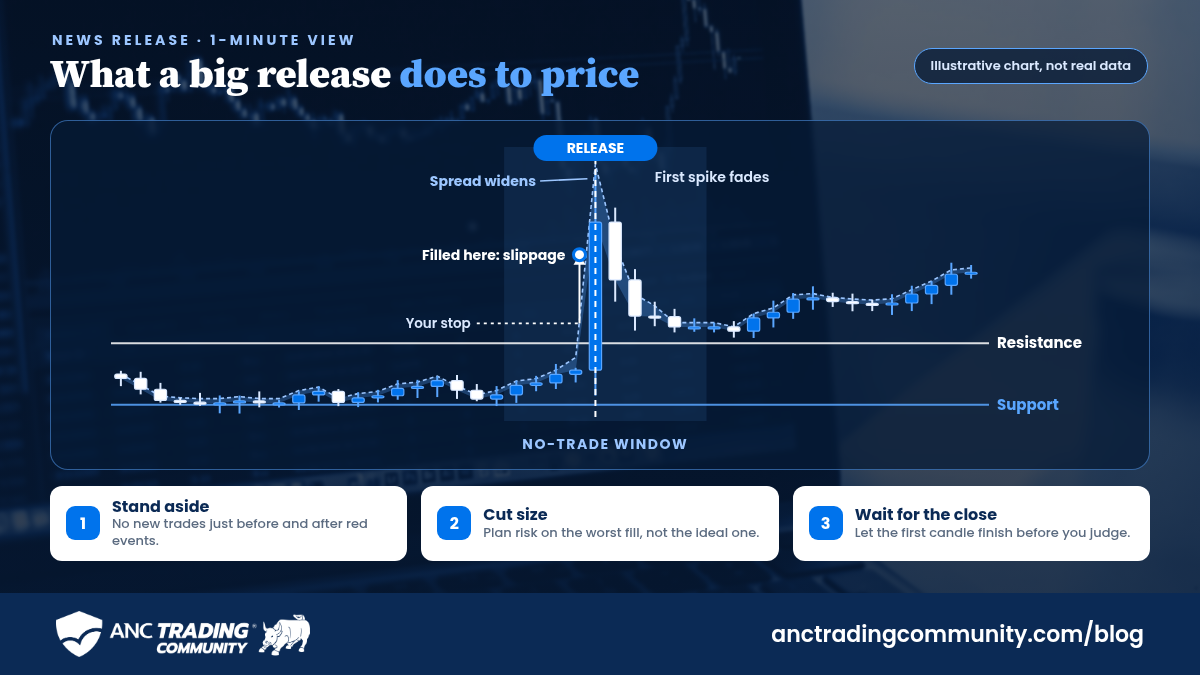
Around a big release, liquidity thins out for a moment. That is where accounts get hurt.
- Spreads widen. The gap between bid and ask can jump for seconds or minutes.
- Slippage grows. Your stop may fill far from your level in a fast move.
- Price whipsaws. The first spike often flips before the real move.
Many traders follow simple rules here. First, open no new trades in the minutes before and after a red event. Also, cut size if you already hold a trade. Finally, let the first candle close before you judge the move.
Spreads and fills differ by broker. Check regulated options where you live on our brokers by country page.
A Weekly Routine to Read the Economic Calendar
Ten minutes on Sunday saves a lot of pain. Here is a simple routine to read the economic calendar every week.
- Set your time zone and filter to the currencies you trade.
- Mark every red event, then add orange ones for your pairs.
- Note the forecast and previous so you know what counts as a surprise.
- Check bank holidays, because grey rows mean thinner markets.
- Plan your no-trade windows around those events.
- Recheck each day before your session, since times can change.
FAQ: How to Read the Economic Calendar
How do you read an economic calendar?
To read an economic calendar, check the time, currency and impact of each event. After the release, compare the actual figure with the forecast.
What do actual, forecast and previous mean?
Actual is the real figure, forecast is the expected one and previous is the last one. Prices react mostly to the gap between actual and forecast.
What does a red folder mean on Forex Factory?
It means high impact expected. Events such as NFP, CPI and rate decisions have often caused big moves.
Which events move the market most?
US jobs data, US inflation and central bank rate calls top the list. GDP and PMIs matter too when they surprise.
Should beginners trade during high-impact news?
Most new traders do better on the sidelines. Spreads widen and slippage rises, so a good idea can still lose on a bad fill.
What time is NFP released?
It comes out at 8:30am New York time on the first Friday of the month. Set your time zone to see it in local time.
Want the desk side of this? Join ANC Trading Community free for the analysis, tools and community. Choosing where to trade? Compare regulated brokers side by side on our broker comparison page, or browse our top broker listing to find the right fit.

Go Beyond the Charts, hosted by ANC Trading Community, is an exclusive FX VIP business meeting on 22 November 2026. It is free to join. So register to attend and meet leaders, brokers and serious traders in one room.
Risk warning: Forex, gold and CFDs are complex instruments and come with a high risk of losing money rapidly due to leverage. A high percentage of retail investor accounts lose money when trading CFDs. News releases can cause sudden gaps, wider spreads and slippage. This article is for information only and is not investment advice. The examples use illustrative numbers, not real data.
Explore more practical guides on the ANC Stock Investments blog.